Showing posts with label bandwidth. Show all posts
Showing posts with label bandwidth. Show all posts
Friday, October 20, 2017
Bandwidth Stabilizer Script for Mikrotik Router
Bandwidth Stabilizer Script for Mikrotik Router
Internet connection by the Internet service provider (ISP) which has many clients that tends to increase with time goes. The problem comes when the increased number of clients that they have not comparable with the services that they purchased from the first party. From the client side like me can not do anything with ISP services are diminishing because of the large number of their clients. Of course ISP will dodge with a lot of reasons if called has provides with bad services. On this situation it is hard to say which one the best ISP that can provide a good services.
Internet connection that slower than standard bandwidth speed of which we should get caused a lot of possibilities. Such as the quality of the wireless equipment used, technical installation of the wireless network, interference frequencies are used, overload client that the ISP have, and etc. So I dont say that this script will be able to overcome the slow internet connection absolutely. This script just only help to stabilize the connection upon congested traffic, the rest just the ISP that knowing.
Congested Traffic to be one of the causes of ping enlarge that make connection to be slow. We will harness the ability of Mikrotik in conditioning ping and finding a bus way during congested traffic so that the connection does not hang on. But the most common problem was caused by technical problem associated with the ISP related to the number of clients that they have.
OK we get started immediately for Bandwidth Stabilizer Script On Mikrotik Winbox by making mangle rule on the firewall and queue tree
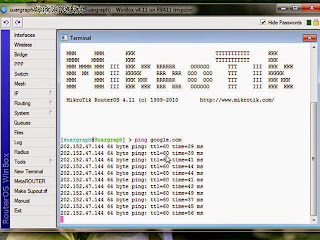
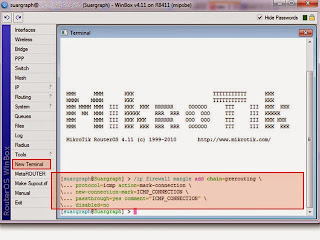
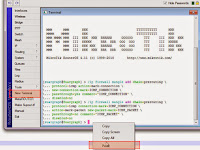
1. Login to the Winbox with account that you have. Then click the New Terminal menu and enter the following script at the cursor terminal window. As shown like the picture below
/ip firewall mangle add chain=prerouting protocol=icmp action=mark-connection new-connection-mark=ICMP_CONNECTION passthrough=yes comment="ICMP_CONNECTION" disabled=no
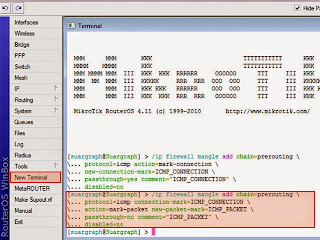
Still in the terminal window, enter the second mangle firewall script below. Right-click at the cursor and paste therein. As shown like the picture below.
/ip firewall mangle add chain=prerouting protocol=icmp connection-mark=ICMP_CONNECTION action=mark-packet new-packet-mark=ICMP_PACKET passthrough=no comment="ICMP_PACKET" disabled=no
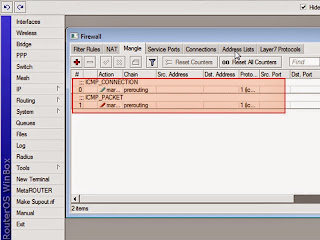
Then you can see the result on the firewall window at mangle tab. The both script that we enter to the terminal window above will create a rule on the firewall mangle on the Mikrotik. As shown like the picture below.
2. The Next we are going to create a queue tree rule. Click on the New terminal again and enter the following script by right click at the cursor on the terminal window and paste therein, as shown like the picture below.
/queue tree add name="==PING_CONDITION==" parent=global-total packet-mark=ICMP_PACKET limit-at=0 queue=default priority=1 max-limit=0 burst-limit=0 burst-threshold=0 burst-time=0s
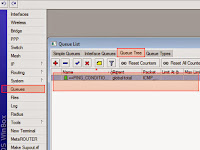
At last we going to see the third script that we have inserted by click on queues>Queue Tree. It will look like at the right picture above. From my experience these script just only to stabilize the connection to avoid hang on when browsing during congested traffic usually at the daytime. If you are curious you can try this! Good Luck!
Available link for download
Saturday, June 24, 2017
Bandwidth Management on Mikrotik using Winbox
Bandwidth Management on Mikrotik using Winbox

Bandwidth share with PCQ (Per Connection Queue) principally is using the queue method to specify the bandwidth usage on the multiple clients. PCQ in the Mikrotik router already installed by default and a program to manage internet traffic network QoS (Quality of Service ). The Method of Bandwidth Management here in order to share bandwidth internet connection is equal among client that you have.
For example we have the internet connection bandwidth of 2000 kbps, and we want to share to 10 clients that will get the bandwidth allotted 2000/10 kbps = 200 kbps. and if we have 5 client that use the internet will divide 2000/5 kbps = 400 kbps. When 10 client using at the time, at the peak condition will get bandwidth quota around 100 kbps each other. Ok lets practice this !
- Assuming we have local network address 192.168.1.0/24 and the interface that connected to the local area network we called as "lan". and the interface that lead that led to the Internet Service Provider (ISP) we called as "public" (note it is up to you give the name of the interface, the function is just distinguish where the name intranet and internet).
- We will use Mikrotik Winbox to be interface software tool
- We will create a firewall setting mark
1. Okay we begin from the First Command
/ip firewall mangle add chain=forward src-address=192.168.1.0/24 action=mark-connection new-connection-mark=NET1-CM
Go to Winbox and, select IP > firewall >Mangle tab then click on "+" button will shown as the picture below:

On the General tab as shown as the picture above fill Chain : with forward, and Src Address : with local network IP address (192.168.1.0/24). After that still on Mangle Rule go to Action tab, will shown as the picture below :

Fill the form fields as shown as the picture above! if you do was right the result can be seen by click on IP > Firewall as shown below!

2. The second command is
/ip firewall mangle add connection-mark=NET1-CM action=mark-packet new-packet-mark=NET1-PM chain=forward
in order to making mark packet
enter through IP > firewall > mangle tab then click on "+" button

You just need to set up chain = forward and Connection Mark = NET1-CM, then go to the action tab

Completed the fields as the picture above, if you do was right, you can see the results by clicking again on IP > Firewall , as shown like the picture bellow :

3. The Third Command is Making queue types “with name of pcq_downstream”
/queue type add name=pcq_downsteam kind=pcq pcq-classifier=dst-address
Return to the main menu select Winbox Queues at Queue List select tab Queue Types then press button "+"

Completed the field as shown like the picture above!, Limit and Total Limit is depending on the ISP bandwidth that you have, in this case the internet connection that use is up to 2 mbps.
4. the Fourth Command is to make queue types “with name pcq_upstream”
/queue type add name=pcq_upstream kind=pcq pcq-classifier=src-address
Still on the main menu select Winbox Queues at Queue List select tab Queue Types then press "+" button

Just like downsteam, upsteam settings as above to adjust with your internet connection limitation totally
5. The Fifth Command is to make queue tree interface “lan”
/queue tree add parent=lan queue=pcq_downsteam packet-mark=NET1-PM
Starting from the main menu select Winbox again Queues at Queue List select tab Queue Three then press "+" button

Adjust the settings as shown like the picture above, the difference is the Parent, depending on your internet connection of your ISP, if you do not know, you can see that by clicking on the menu Interface from the main menu Winbox

In this case the name of lan interface is ether1, public interface is wlan1. if you have already know, completed with your Parent according with the name of your lan interface.
6. the Sixth Command is to make queue tree interface “public”
/queue tree add parent=public queue=pcq_upstream packet-mark=NET1-PM
begin from the main menu select Winbox again Queues at Queue List select tab Queue Three then press "+" button

Surely you can guess already what is the difference about the picture above that is the fields of the Parent, adjust the name according to your public interface.
Ok from six steps above I could have a summary. This is the short way if you dont want to take a long time. Go to the main menu of the winbox, this is the following practical steps:
For more details, lets see the following video ! hopefully useful for you and good luck!
/ip firewall mangle add chain=forward src-address=192.168.1.0/24 action=mark-connection new-connection-mark=NET1-CM
/ip firewall mangle add connection-mark=NET1-CM action=mark-packet new-packet-mark=NET1-PM chain=forward
/queue type add name=pcq_downsteam kind=pcq pcq-classifier=dst-address
/queue type add name=pcq_upstream kind=pcq pcq-classifier=src-address
/queue tree add parent=lan queue=pcq_downsteam packet-mark=NET1-PM
/queue tree add parent=public queue=pcq_upstream packet-mark=NET1-PM
Copy the six comment above into the notepad, and change the IP address marked with red color, green color is lan interface, public interface marked with blue, according to your internet connection. Then go to the main menu of Winbox, and click on the New Terminal. After you have changes the six steps above, then paste by right click on the active Terminal at the cursor./ip firewall mangle add connection-mark=NET1-CM action=mark-packet new-packet-mark=NET1-PM chain=forward
/queue type add name=pcq_downsteam kind=pcq pcq-classifier=dst-address
/queue type add name=pcq_upstream kind=pcq pcq-classifier=src-address
/queue tree add parent=lan queue=pcq_downsteam packet-mark=NET1-PM
/queue tree add parent=public queue=pcq_upstream packet-mark=NET1-PM
For more details, lets see the following video ! hopefully useful for you and good luck!
Available link for download
Friday, March 10, 2017
Bandwidth Monitoring Tools For Linux
Bandwidth Monitoring Tools For Linux
Bandwidth in computer networking refers to the data rate supported by a network connection or interface. One most commonly expresses bandwidth in terms of bits per second (bps). The term comes from the field of electrical engineering, where bandwidth represents the total distance or range between the highest and lowest signals on the communication channel (band).
Bandwidth represents the capacity of the connection. The greater the capacity, the more likely that greater performance will follow, though overall performance also depends on other factors, such as latency.
Bandwidthd
BandwidthD tracks usage of TCP/IP network subnets and builds html files with graphs to display utilization. Charts are built by individual IPs, and by default display utilization over 2 day, 8 day, 40 day, and 400 day periods. Furthermore, each ip address’s utilization can be logged out at intervals of 3.3 minutes, 10 minutes, 1 hour or 12 hours in cdf format, or to a backend database server. HTTP, TCP, UDP, ICMP, VPN, and P2P traffic are color coded.
Current Stable Version :- 2.0.1
Project Home Page :- http://bandwidthd.sourceforge.net/
Bmon
bmon is a portable bandwidth monitor and rate estimator running on various operating systems. It supports various input methods for different architectures. Various output modes exist including an interactive curses interface,lightweight HTML output but also formatable ASCII output.
Bwbar
bwbar is a small C-based program for Linux-based machines which produces bandwidth usage statistics for a network interface. It was originally written by H. Peter Anvin, and I (Brian Towne) modified it somewhat to better suit my needs. The original program was released under the GPL. A number of people have asked for the modified program and its source, so I have created this page.
Current Stable Version :- 1.2.3
bwm
This is a very tiny bandwidth monitor (not X11). Can monitor up to 16 interfaces in the in the same time, and shows totals too.
Current Stable Version :- 1.1.0
bwm-ng
small and simple console-based bandwidth monitor.Bandwidth Monitor NG is a small and simple console-based live bandwidth monitor.
Current Stable Version :- 0.6
Project Home Page :- http://www.gropp.org/?id=projects&sub=bwm-ng
Cacti
Cacti is a complete network graphing solution designed to harness the power of RRDTool’s data storage and graphing functionality. Cacti provides a fast poller, advanced graph templating, multiple data acquisition methods, and user management features out of the box. All of this is wrapped in an intuitive, easy to use interface that makes sense for LAN-sized installations up to complex networks with hundreds of devices.
Current Stable Version :- 0.8.7e
Project Home Page :- http://cacti.net/
cbm
cbm — the color bandwidth meter — is a small program to display the traffic currently flowing through your network devices.
Current Stable Version :- 0.1
dstat
Dstat is a versatile replacement for vmstat, iostat, netstat, nfsstat and ifstat. Dstat overcomes some of their limitations and adds some extra features, more counters and flexibility. Dstat is handy for monitoring systems during performance tuning tests, benchmarks or troubleshooting.
Current Stable Version :- 0.7.1
Project Home Page :- http://dag.wieers.com/home-made/dstat/
EtherApe
EtherApe is a graphical network monitor for Unix modeled after etherman. Featuring link layer, ip and TCP modes, it displays network activity graphically. Hosts and links change in size with traffic. Color coded protocols display.
Current Stable Version :- 0.9.9
Project Home Page :- http://etherape.sourceforge.net/
gdesklets
gDesklets is a system for bringing mini programs (desklets), such as weather forecasts, news tickers, system information displays, or music player controls, onto your desktop, where they are sitting there in a symbiotic relationship of eye candy and usefulness. The possibilities are really endless and they are always there to serve you whenever you need them, just one key-press away. The system is not restricted to one desktop environment, but currently works on most of the modern Unix desktops (including GNOME, KDE, Xfce).
Current Stable Version :- 0.36.1
Project Home Page :- http://www.gdesklets.de/
GKrellM
GKrellM is a single process stack of system monitors which supports applying themes to match its appearance to your window manager, Gtk, or any other theme.
Current Stable Version :- 2.3.4
Project Home Page :- http://members.dslextreme.com/users/billw/gkrellm/gkrellm.html
ipband
ipband is a pcap based IP traffic monitor. It tallies per-subnet traffic and bandwidth usage and starts detailed logging if specified threshold for the specific subnet is exceeded. If traffic has been high for a certain period of time, the report for that subnet is generated which can be appended to a file or e-mailed. When bandwidth usage drops below the threshold, detailed logging for the subnet is stopped and memory is freed.
Current Stable Version :- 0.8.1
Project Home Page :- http://ipband.sourceforge.net/
iftop
iftop does for network usage what top does for CPU usage. It listens to network traffic on a named interface and displays a table of current bandwidth usage by pairs of hosts. Handy for answering the question “why is our ADSL link so slow”.
Current Stable Version :- 0.17
Project Home Page :- http://www.ex-parrot.com/pdw/iftop/
iperf
Iperf is a tool to measure maximum TCP bandwidth, allowing the tuning of various parameters and UDP characteristics. Iperf reports bandwidth, delay jitter, datagram loss.
ipfm
IP Flow Meter (IPFM) is a bandwidth analysis tool, that measures how much bandwidth specified hosts use on their Internet link.
Current Stable Version :- 0.11.5
Project Home Page :- http://robert.cheramy.net/ipfm/
ifstat
ifstat is a tool to report network interfaces bandwith just like vmstat/iostat do for other system counters.
Current Stable Version :- 1.1
Project Home Page :- http://gael.roualland.free.fr/ifstat/
ibmonitor
ibmonitor is an interactive linux console application which shows bandwidth consumed and total data transferred on all
interfaces.
Current Stable Version :- 1.4
Project Home Page :- http://ibmonitor.sourceforge.net/
ipaudit
IPAudit monitors network activity on a network by host, protocol and port.IPAudit listens to a network device in promiscuous mode, and records every connection between two ip addresses. A unique connection is determined by the ip
addresses of the two machines, the protocol used between them, and the port numbers (if they are communicating via udp or tcp).
Current Stable Version :- 0.95
Project Home Page :- http://ipaudit.sourceforge.net/
IPTraf
IPTraf is a console-based network statistics utility for Linux. It gathers a variety of figures such as TCP connection packet and byte counts, interface statistics and activity indicators, TCP/UDP traffic breakdowns, and LAN station packet and byte counts.
Current Stable Version :- 3.0.0
Project Home Page :- http://iptraf.seul.org/
IFStatus
IFStatus was developed for Linux users that are usually in console mode. It is a simple, easy to use program for displaying commonly needed / wanted statistics in real time about ingoing and outgoing traffic of multiple network interfaces that is usually hard to find, with a simple and effecient view. It is the substitute for PPPStatus and EthStatus projects.
Current Stable Version :- 1.1.0
jnettop
Jnettop is a traffic visualiser, which captures traffic going through the host it is running from and displays streams sorted by bandwidth they use.
Current Stable Version :- 0.13.0
Project Home Page :- http://jnettop.kubs.info/wiki/
MRTG
The Multi Router Traffic Grapher (MRTG) is a tool to monitor the traffic load on network links. MRTG generates HTML pages containing PNG images which provide a LIVE visual representation of this traffic.
Current Stable Version :- 2.16.3
Project Home Page :- http://oss.oetiker.ch/mrtg/
moodss
moodss is a graphical monitoring application. It is modular so that the code accessing the monitored objects is completely separate from the application core. The core takes care of managing modules (loading and unloading),displaying modules data through sortable tables and diverse graphical viewers, handling user set threshold conditions with email alerts, recording and browsing data history from a database.moodss can even predict the future, using sophisticated statistical methods and artificial neural networks, and therefore be used for capacity planning.
Current Stable Version :- 21.5
Project Home Page :- http://moodss.sourceforge.net/
monitord
A lightweight (distributed?) network security monitor for TCP/IP+Ethernet LANs. It will capture certain network events and record them in a relational database. The recorded data will be available for analysis through a CGI based interface.
Current Stable Version :- 4.0
Project Home Page :- http://sourceforge.net/projects/monitord/
Netmrg
NetMRG is a tool for network monitoring, reporting, and graphing. Based on RRDTOOL, the best of open source graphing
systems, NetMRG is capable of creating graphs of any parameter of your network.
Current Stable Version :- 0.20
Project Home Page :- http://www.netmrg.net
nload
nload is a console application which monitors network traffic and bandwidth usage in real time. It visualizes the in-and outgoing traffic using two graphs and provides additional info like total amount of transfered data and min/max network usage.
Current Stable Version :- 0.7.2
Project Home Page :- http://www.roland-riegel.de/nload/index.html
ntop
ntop shows the current network usage. It displays a list of hosts that are currently using the network and reports information concerning the IP (Internet Protocol) and Fibre Channel (FC) traffic generated by each host. The traffic is sorted according to host and protocol. Default protocol list (this is user configurable).
Current Stable Version :- 3.3.10
Project Home Page :- http://www.ntop.org
netspeed
Netspeed is just a little GNOME-applet that shows how much traffic occurs on a specified network device (for example eth0). You get the best impression of it, if you look at the screenshots below.
Current Stable Version :- 0.14
Netwatch
Netwatch is a Linux program created to aid in monitoring Network Connections. It is based on a program called “statnet” but has been substantially modified for its Ethernet emphasis. It is a dynamic program which displays the Ethernet status based each the connection’s activity. It has the capability of monitoring hundreds of site statistics simultaneously. The connection’s port number (Well Known Service) and destination address are available as well. There are options which allow router statistics to be measured on simple networks (with one router). External network communication is counted and transfer rates are displayed.
Current Stable Version :- 1.3.0-1
Project Home Page :- http://www.slctech.org/~mackay/netwatch.html
NOCOL
NOCOL is a popular system and network monitoring (network management) software that runs on Unix systems and can
monitor network and system devices. It uses a very simple architecture and is very flexible for adding new network management modules
Current Stable Version :- 4.3.1
Project Home Page :- http://www.netplex-tech.com/nocol/
NeTraMet
NeTraMet is an open-source (GPL) implementation of the RTFM architecture for Network Traffic Flow Measurement,
developed and supported by Nevil Brownlee at the University of Auckland. Nevil also developed a version of NeTraMet
which uses the CoralReef library to read packet headers. This ‘CoralReef NeTraMet meter’ can work with any CoralReef
data source; it has been tested on both CAIDA and NLANR trace files, and on DAG and Apptel ATM interface cards.
Current Stable Version :- 43
Project Home Page :- http://freshmeat.net/projects/netramet/
NetPIPE
NetPIPE is a protocol independent performance tool that visually represents the network performance under a variety of
conditions. It performs simple ping-pong tests, bouncing messages of increasing size between two processes, whether
across a network or within an SMP system. Message sizes are chosen at regular intervals, and with slight perturbations, to provide a complete test of the communication system. Each data point involves many ping-pong tests to provide an accurate timing. Latencies are calculated by dividing the round trip time in half for small messages ( <64 Bytes ).
Current Stable Version :- 3.7.1
Project Home Page :- http://www.scl.ameslab.gov/netpipe/
netperf
Netperf is a benchmark that can be use to measure various aspect of networking performance. The primary foci are bulk
(aka unidirectional) data transfer and request/response performance using either TCP or UDP and the Berkeley Sockets interface. As of this writing, the tests available either unconditionally or conditionally
Current Stable Version :- 2.4.5
Project Home Page :- http://www.netperf.org/netperf/
potion
This is a console utility which will listen on an interface using libpcap, aggregate the traffic into flows and display the top (as many as can fit on your screen) flows with their average throughput. A flow is identified ip protocol, source ip, source port, destination ip, destination port, and type of service flag.
Current Stable Version :- 0.0.4
pktstat
Display a real-time list of active connections seen on a network interface, and how much bandwidth is being used by what. Partially decodes HTTP and FTP protocols to show what filename is being transferred. X11 application names are also shown. Entries hang around on the screen for a few seconds so you can see what just happened. Also accepts filter expressions á la tcpdump.
Current Stable Version :- 1.8.4
Project Home Page :- http://www.adaptive-enterprises.com.au/~d/software/pktstat/
RTG
RTG is a flexible, scalable, high-performance SNMP statistics monitoring system. It is designed for enterprises and service providers who need to collect time-series SNMP data from a large number of targets quickly. All collected data is inserted into a relational database that provides a common interface for applications to generate complex queries and reports. RTG includes utilities that generate configuration and target files, traffic reports, 95th percentile reports and graphical data plots. These utilities may be used to produce a web-based interface to the data.
Current Stable Version :- 0.7.4
Project Home Page :- http://rtg.sourceforge.net/
speedometer
Monitor network traffic or speed/progress of a file transfer. The program can be used for cases like: how long it will take for my 38MB transfer to finish, how quickly is another transfer going, How fast is the upstream on this ADSL line and how fast can I write data to my filesystem.
Current Stable Version :- 2.6
Project Home Page :- http://excess.org/speedometer/
Spong
Spong is a simple system-monitoring package written in Perl. It features client based monitoring, monitoring of network services, results displayed via the Web or console, history of problems, and flexible messaging when problems occur.
Current Stable Version :- 2.7.6
Project Home Page :- http://spong.sourceforge.net/
slurm
slurm started as a pppstatus port to FreeBSD. As I ripped off several functions
Current Stable Version :- 0.3.3
SNIPS
SNIPS (System & Network Integrated Polling Software) is a system and network monitoring software that runs on Unix systems and can monitor network and system devices. It is capable of monitoring DNS, NTP, TCP or web ports, host performance, syslogs, radius servers, BGP peers, etc. New monitors can be added easily (via a C or Perl API).
Current Stable Version :- 1.1
Project Home Page :- http://www.navya.com/software/snips/
tcpflow
tcpflow is a program that captures data transmitted as part of TCP connections (flows), and stores the data in a way
that is convenient for protocol analysis or debugging. A program like tcpdump shows a summary of packets seen on the
wire, but usually doesn’t store the data that’s actually being transmitted. In contrast, tcpflow reconstructs the actual data streams and stores each flow in a separate file for later analysis. tcpflow understands TCP sequence numbers and will correctly reconstruct data streams regardless of retransmissions or out-of-order delivery.
Current Stable Version :- 0.21
Project Home Page :- http://www.circlemud.org/~jelson/software/tcpflow/
vnstat
vnStat is a network traffic monitor for Linux that keeps a log of daily network traffic for the selected interface(s).vnStat isn’t a packet sniffer. The traffic information is analyzed from the /proc -filesystem, so vnStat can be used without root permissions. However at least a 2.2.x kernel is required.
Current Stable Version :- 1.10
Project Home Page :- http://humdi.net/vnstat/
WMND
Shows a graph of incoming/outgoing traffic, activity indicators for rx/tx and current/maximum rate for rx/tx in bytes or packets.Tailored for use with WindowMaker, it will as well work with any other window manager though.
Current Stable Version :- 0.4.13
Project Home Page :- http://dockapps.org/file.php/id/178
Available link for download
Subscribe to:
Posts (Atom)